September 11, 2016
Network logs analysis
The "projects" side is quite silent at the moment (school start is always inconvenient). Even if I finished my studies long time ago, the trauma remains. One day (hot Saturday), I was bored and I was not brave enough to motivate my brain for a constructive work. As I do very often, I decided to check if the servers were OK and suddenly, I had this idea: let's write a report about the network.
If you work in the IT industry, you already know the logs are a vital piece. Sometimes, a random issue occurs and by accident, the events were not "recorded". What a painful situation! Here, we have shiny logs with a lot of information, so it is time to analyze them (before it's too late). Plenty of similar articles were written on the Internet, but I still want to share my discoveries.
Under the ice...
For the first part, I will only focus on a specific server that includes a plain iptables firewall (that means Linux here), written by me (I'm not using fail2ban). It is a simple SSH gateway accepting 3 SSH connections per hour. If a fourth connection is initiated, the source get banned for a hour and all further attempts are logged, with a limit of one line per minute. The host is regularly attacked so the logs were verbose.
Before we begin, logs are copied to another directory, so I can process them without any risks.
$ mkdir netlogz && cd netlogz && cp /var/log/messages* .
$ du -sh messages*
84K     messages
2,4M    messages.1
2,4M    messages.2
6,0M    messages.3
4,0M    messages.4
3,6M    messages.5
Yeah, interesting logs, but how many iptables(8) lines?
$ grep -c 'IPTABLES' messages*
messages: 304
messages.1: 8736
messages.2: 9052
messages.3: 22980
messages.4: 15028
messages.5: 13692
The firewall logs started at Jul 29 14:18:11 and
stopped at Sep 11 18:10:30 (this coincides with the
final article draft). A typical line looks like this:
Sep 3 01:28:41 opinel kernel: [3064536.809155] IPTABLES:SSH:DROPPED IN=eth1 OUT= MAC=c6:0a:a1:c8:f2:67:88:43:e1:7e:7b:ff:06:00 SRC=123.59.86.248 DST=192.168.5.100 LEN=60 TOS=0x00 PREC=0x00 TTL=43 ID=18401 DF PROTO=TCP SPT=44207 DPT=22 WINDOW=14140 RES=0x00 SYN URGP=0I'm going to redirect all spare logs to a new file called
messages.ALL, to avoid unnecessary for
loops:
$ cat messages.* messages >messages.ALL
$ wc -l messages.ALL
72284 messages.ALL
We are interested in the SRC= field. I'm used to
awk(1), so I decided to write a tiny
snippet to isolate the address that started the connection.
BEGIN { FS = " " }

/IPTABLES:SSH:DROPPED/ {
	match($0, /SRC=[0-9]+\.[0-9]+\.[0-9]+\.[0-9]+/)
	ip = substr($0,RSTART+4,RLENGTH-4)
	printf("%s\n", ip)
}
/IPTABLES:SSH:DROPPED/ will only search the lines
that contain IPTABLES:SSH:DROPPED. It is a convention
I chose, on my boxes. match() is used to extract the
field that contains an IP address, with a generic digit pattern
it will drag SRC=5.164.112.20 or
SRC=58.64.163.132 for example. SRC= is
useless so we purge it with RSTART+4
(RSTART is set by the match function).
How many addresses were picked?
$ awk -f ipextract messages.ALL | wc -l
69792
We want to count how many times the bots attempted to connect on the machine or simply scanned the opened ports. It's time to sort the IPs in a numeric order:
$ awk -f ipextract messages.ALL | sort -t. -k1,1n -k2,2n -k3,3n -k4,4n
5.164.112.20
5.164.112.20
5.164.122.212
5.164.122.212
[...]
222.255.174.50
222.255.174.50
223.4.119.96
223.4.119.96
To avoid a wrong sorting with sort(1) (only with
-n), each field has to be sorted out separately
hence the -k options. If you omit that, you will
encounter something like this:
192.168.1.100
192.168.1.111
192.168.1.200
192.168.1.3
192.168.1.56
192.168.1.7
192.168.1.9
Hum, this is starting to be exciting! The final countdown is getting shown. For the sake of convenience, I'm going to redirect the sorted addresses in a file. Of course, piping the other additional commands is possible but I want to write "understandable" one liners, in the article:
$ awk -f ipextract messages.ALL | sort -t. -k1,1n -k2,2n -k3,3n -k4,4n >IPLIST
$ uniq -c IPLIST | sort -rn | head -12
  21170 221.229.172.103
  12056 221.229.172.97
  10350 221.229.172.104
   6278 112.85.218.11
   2816 221.229.172.35
   1742 221.229.172.99
   1052 217.172.189.102
    792 111.93.142.33
    722 221.229.172.102
    670 167.160.162.191
    444 163.172.169.151
    380 123.56.229.44
Finally, we have a winner 221.229.172.103. As you
can see the 221.229.172.0/24 subnet is also very
active right now.
$ uniq -c IPLIST | sort -rn | head -12 | grep "221.229.172"
  21170 221.229.172.103
  12056 221.229.172.97
  10350 221.229.172.104
   2816 221.229.172.35
   1742 221.229.172.99
    722 221.229.172.102
The recurrent aggressions from 221.229.172.0/24
started on July and ended in September.
$ grep "221.229.172" messages.ALL | head -1
Jul 29 14:18:11 opinel kernel: [  305.962282] IPTABLES:SSH:DROPPED IN=eth1 OUT= MAC=48:0a:e9:58:a2:97:88:43:e1:7d:7b:ff:05:00 SRC=221.229.172.102 [...]
$ grep "221.229.172" messages.ALL | tail -1
Sep  9 10:58:00 opinel kernel: [3617095.157109] IPTABLES:SSH:DROPPED IN=eth1 OUT= MAC=48:0a:e9:58:a2:97:88:43:e1:7d:7b:ff:05:00 SRC=221.229.172.35 [...]
Summary:
221.229.172.103: from 'Aug 24 17:46:35' to 'Sep  7 19:59:48'
221.229.172.97:  from 'Aug  9 04:26:08' to 'Aug 18 18:03:44'
221.229.172.104: from 'Aug 18 18:17:43' to 'Aug 24 17:31:40'
Look closely. What do you see? Yes, the addresses were switched.
When 221.229.172.97 stopped,
a new attack from the same VLAN (221.229.172.104)
started 14 minutes after. An analogous mechanism applied with
221.229.172.103 (15 minutes after).
For this short period of time and a host that do not have a great exposure, it is kinda insane! It becomes even more crazy when you remember what I told you earlier: ONLY one line per minute. As the connections are launched X times per minute, I think those numbers could be multiplied by 3, at least. The server is just attacked all day long and it started many days ago (and it is not over yet as another big attack started). I do not know if the provider should be warned though (banning chinese subnets is an endless task).
Now, I would like to see the number of abusers that were blocked each day. I wrote another snippet (sh(1) friendly):
for m in Jul Aug Sep; do
	i=1
	while [ "$i" -le 31 ]; do
		LOG_DAY="$(grep -E "$m +${i} " "$1" | grep -c "IPTABLES:SSH:DROPPED")"
		printf "%s\t%s\n" "$LOG_DAY" "$m $i"
		i="$(( i + 1 ))"
	done
done
For every day in July, August and September, we will search for
the date pattern (Aug 8 or Sep 10),
retain and count IPTABLES lines. Then, we increment
the date (there are 31 days in July and August). Here the command
lines:
$ sh iprate messages.ALL | grep -v '^0'
266     Jul 29
1558    Jul 30
218     Jul 31
188     Aug 1
588     Aug 2
2058    Aug 3
766     Aug 4
2140    Aug 5
814     Aug 6
144     Aug 7
2310    Aug 8
1886    Aug 9
1386    Aug 10
1608    Aug 11
1066    Aug 12
1618    Aug 13
756     Aug 14
986     Aug 15
2538    Aug 16
2642    Aug 17
2826    Aug 18
2394    Aug 19
1582    Aug 20
2124    Aug 21
2342    Aug 22
1134    Aug 23
3278    Aug 24
3138    Aug 25
1542    Aug 26
336     Aug 27
1964    Aug 28
2726    Aug 29
520     Aug 30
2192    Aug 31
1182    Sep 1
144     Sep 2
2294    Sep 3
2932    Sep 4
1280    Sep 5
1892    Sep 6
3036    Sep 7
1600    Sep 8
1450    Sep 9
48      Sep 10
300     Sep 11
What were the darkest days?
$ sh iprate messages.ALL | grep -v '^0' | sort -rn | head -10
3278    Aug 24
3138    Aug 25
3036    Sep 7
2932    Sep 4
2826    Aug 18
2726    Aug 29
2642    Aug 17
2538    Aug 16
2394    Aug 19
2342    Aug 22
Here a chart to summarize all the previous statistics:
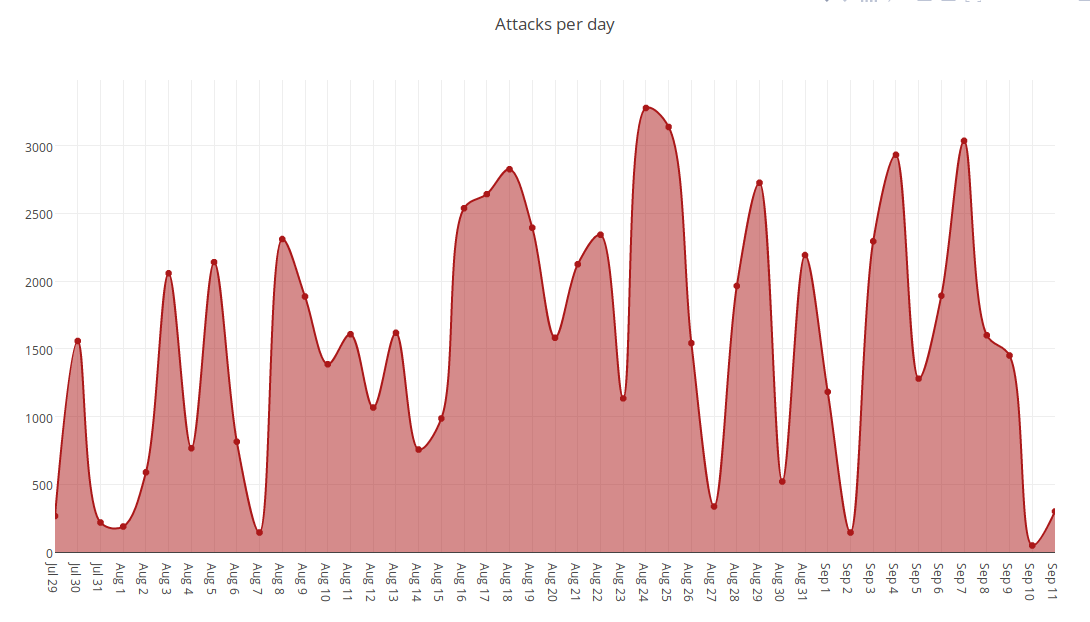
As you can see, filtering incoming SSH connections is just
mandatory to relieve the OpenSSH server (it's my personal opinion).
A drastic sshd config is applied too but it's not
enough. It is still a wonderful barrier against old, bad or
misconfigured clients, though:
$ grep -c "no hostkey alg" /var/log/auth.log
2843
I did not have many invalid user lines and most of
the time, it was admin. That makes me a little sad
actually (those bots are not funny). Few months ago, I remember
having pikachu or rms.
To conclude: I might install and set up a honeypot one day (once the life is cooler), to be able to get more input.
...berg
For the second part, I am going to dig into another box that is
running a secondary website (and powered by a 4.4BSD-based
UNIX-like OS). Something I love with httpd logs,
it is that you always find something new. As before:
$ cat access.log.3 access.log.2 access.log.1 access.log.0 access.log >access.log.ALL
$ wc -l access.log.ALL
  14679 access.log.ALL
Let's start gentle:
sausagecheesedude.fr 163.172.152.73 - - [17/Aug/2016:00:06:48 +0200] "GET /webadmin/scripts/setup.php HTTP/1.1" 404 0
sausagecheesedude.fr 163.172.152.73 - - [17/Aug/2016:00:06:48 +0200] "GET /sqlweb/scripts/setup.php HTTP/1.1" 404 0
sausagecheesedude.fr 163.172.152.73 - - [17/Aug/2016:00:06:49 +0200] "GET /webdb/scripts/setup.php HTTP/1.1" 404 0
sausagecheesedude.fr 163.172.152.73 - - [17/Aug/2016:00:06:49 +0200] "GET /mysql-admin/scripts/setup.php HTTP/1.1" 404 0
sausagecheesedude.fr 163.172.152.73 - - [17/Aug/2016:00:06:49 +0200] "GET /databaseadmin/scripts/setup.php HTTP/1.1" 404 0
sausagecheesedude.fr 163.172.152.73 - - [17/Aug/2016:00:06:49 +0200] "GET /admm/scripts/setup.php HTTP/1.1" 404 0
sausagecheesedude.fr 163.172.152.73 - - [17/Aug/2016:00:06:49 +0200] "GET /admn/scripts/setup.php HTTP/1.1" 404 0
sausagecheesedude.fr 163.172.152.73 - - [17/Aug/2016:00:06:49 +0200] "GET /_admin/scripts/setup.php HTTP/1.1" 404 0
sausagecheesedude.fr 163.172.152.73 - - [17/Aug/2016:00:06:49 +0200] "GET /_phpmyadmin/scripts/setup.php HTTP/1.1" 404 0
sausagecheesedude.fr 163.172.152.73 - - [17/Aug/2016:00:06:49 +0200] "GET /~/PMA/scripts/setup.php HTTP/1.1" 404 0
sausagecheesedude.fr 163.172.152.73 - - [17/Aug/2016:00:06:49 +0200] "GET /3rdparty/phpMyAdmin/scripts/setup.php HTTP/1.1" 404 0
sausagecheesedude.fr 163.172.152.73 - - [17/Aug/2016:00:06:49 +0200] "GET /admin/mysql/scripts/setup.php HTTP/1.1" 404 0
Oh oh oh, a muieblackcat is triggered. I can bet
it won't be the last one. Since I have no PHP
installed, I can just drunk a beer.
I will not post you the lines about phpmyadmin or
the other sqlitemanager buddies, but here an
insight:
$ grep -ic "php" access.log.ALL
442
Strange... We are not talking about the usual CMS. Hum, you spoke too fast, pal:
sausagecheesedude.fr 46.161.9.35 - - [14/Aug/2016:20:29:55 +0200] "POST /wp-content/plugins/inboundio-marketing/admin/partials/csv_uploader.php HTTP/1.1" 404 0
sausagecheesedude.fr 46.161.9.35 - - [14/Aug/2016:20:37:21 +0200] "POST /wp-content/plugins/dzs-zoomsounds/admin/upload.php HTTP/1.1" 404 0
sausagecheesedude.fr 46.161.9.35 - - [14/Aug/2016:20:38:11 +0200] "POST /wp-content/plugins/dzs-zoomsounds/admin/upload.php HTTP/1.1" 404 0
sausagecheesedude.fr 46.161.9.35 - - [14/Aug/2016:20:38:54 +0200] "POST /wp-content/plugins/dzs-zoomsounds/admin/upload.php HTTP/1.1" 404 0
sausagecheesedude.fr 46.161.9.35 - - [14/Aug/2016:20:39:53 +0200] "POST /wp-content/plugins/dzs-zoomsounds/admin/upload.php HTTP/1.1" 404 0
sausagecheesedude.fr 46.161.9.35 - - [14/Aug/2016:21:03:26 +0200] "POST /wp-content/plugins/reflex-gallery/admin/scripts/FileUploader/php.php?Year=2016%26Month=08 HTTP/1.1" 404 0
sausagecheesedude.fr 46.161.9.35 - - [14/Aug/2016:21:04:09 +0200] "POST /wp-content/plugins/reflex-gallery/admin/scripts/FileUploader/php.php?Year=2016%26Month=08 HTTP/1.1" 404 0
sausagecheesedude.fr 46.161.9.35 - - [14/Aug/2016:21:22:57 +0200] "POST /wp-content/plugins/simple-ads-manager/sam-ajax-admin.php HTTP/1.1" 404 0
sausagecheesedude.fr 66.249.76.72 - - [06/Sep/2016:17:31:03 +0200] "GET /wp-content/plugins/syntaxhighlighter/syntaxhighlighter3/styles/shThemeEclipse.css?ver=3.0.83c HTTP/1.1" 301 0
sausagecheesedude.fr 164.132.161.20 - - [06/Sep/2016:19:31:10 +0200] "GET /wp-content/uploads/2011/10/screenFetch-2011-10-02_13-04-05.png HTTP/1.1" 301 0
sausagecheesedude.fr 66.249.64.4 - - [07/Sep/2016:00:56:04 +0200] "GET /wp-content/plugins/syntaxhighlighter/syntaxhighlighter3/styles/shThemeDefault.css?ver=3.0.83c HTTP/1.1" 301 0
sausagecheesedude.fr 66.249.64.7 - - [07/Sep/2016:04:40:25 +0200] "GET /wp-content/plugins/syntaxhighlighter/syntaxhighlighter3/styles/shThemeEclipse.css?ver=3.0.83c HTTP/1.1" 301 0
One more time, we can see that Wordpress CMS is a favourite target. Obviously, those plugins are flawed and that justifies the requests. Installing deprecated and/or unmaintained plugins is the mistake people do. Since I have no Wordpress installed, I can just drunk another beer.
Common HTTP response status codes:
$ grep -c "301 0$" access.log.ALL
2822
$ grep -c "304 0$" access.log.ALL
2738
$ grep -c "403 0$" access.log.ALL
3
$ grep -c "404 0$" access.log.ALL
1193
This apart, the httpd logs are kinda quiet and
it was less fun to explore, compared to the firewalls. That's
exactly why I'm not a fond of www. Maybe I should
install PHP and mysql and stop static
content only, to spice up my life? The last paragraphs were drafted
in a repetitive beep tone, thanks to my two UPS yelling about the
absence of currents. What a sad sunday.